A velocity time graph is a graphical representation of the velocity covered by a body in motion per unit
time. The area under a velocity time graph is displacement and the slope gives the acceleration of
the body in motion.
$$ \text{where, slope} = \frac{∆v}{∆t} $$
Types of velocity-time graph
- Graph of a uniformly accelerating body
If a body undergoing motion starts from rest or accelerates uniformly from a point x, the velocity time graph for
this motion is shown below:
.png) $$ a = \frac{{v_2} - {v_1}}{{t_2} - {t_1}} $$
$$\text{the distance covered is given by:} $$
$$ s = \text{area of a triangle} $$
$$ s = \frac{1}{2}bh $$
$$ where, $$
$$ b = {t_2} - {t_1} $$
$$ h = {v_2} - {v_1} $$
$$ a = \frac{{v_2} - {v_1}}{{t_2} - {t_1}} $$
$$\text{the distance covered is given by:} $$
$$ s = \text{area of a triangle} $$
$$ s = \frac{1}{2}bh $$
$$ where, $$
$$ b = {t_2} - {t_1} $$
$$ h = {v_2} - {v_1} $$
- Graph of a body undergoing uniform velocity in a straight line
When a body maintains uniform speed over a period of time. The velocity time graph is given below:
.png) $$ speed = \frac{distance}{time} $$
$$\text{The distance covered is given by: } $$
$$ s = \text{area of a rectangle} $$
$$ s = l × b $$
$$ where, $$
$$ l = h = {v_2} - {v_1} $$
$$ b = {t_2} - {t_1} $$
$$ speed = \frac{distance}{time} $$
$$\text{The distance covered is given by: } $$
$$ s = \text{area of a rectangle} $$
$$ s = l × b $$
$$ where, $$
$$ l = h = {v_2} - {v_1} $$
$$ b = {t_2} - {t_1} $$
- Graph of a body undergoing uniform decceleration or retardation
The graph for a body undergoing uniform decceleration or retardation is given below:
.png) $$ retardation = \frac{∆v}{∆t} $$
$$ \text{retardation is always negative} $$
$$\text{The distance covered is given by} $$
$$ s = \frac{1}{2}bh $$
$$ retardation = \frac{∆v}{∆t} $$
$$ \text{retardation is always negative} $$
$$\text{The distance covered is given by} $$
$$ s = \frac{1}{2}bh $$
Combination of motion
A body can undergo both acceleration and uniform deceleration or a combination of the three motions. The distance
covered in the velocity time graph is the area of the shape of the graph or a combination of shapes.
The distance covered by a body which accelerates uniformly from rest, maintains a uniform speed and decelerates
uniformly to rest at different time intervals as shown in the diagram below is given by:
.jpeg) $$ s = \frac{1}{2}(a+ b) × V $$
$$ s = \text{area of a trapezium}$$
$$ where, $$
$$ b = \text{total time} $$
$$ a = \text{time taken for uniform velocity} $$
$$ s = \frac{1}{2}(a+ b) × V $$
$$ s = \text{area of a trapezium}$$
$$ where, $$
$$ b = \text{total time} $$
$$ a = \text{time taken for uniform velocity} $$
Calculations
Example 1: A car starts from rest at a check point A and comes to rest at the next check point B, 6km away
in 3 mins. It has first a uniform acceleration for 40s then a constant speed and it is brought to rest with a
uniform retardation after 20s. Sketch a velocity time graph for the motion. Determine the
- Maximum speed
- Retardation
(NECO)
Solution
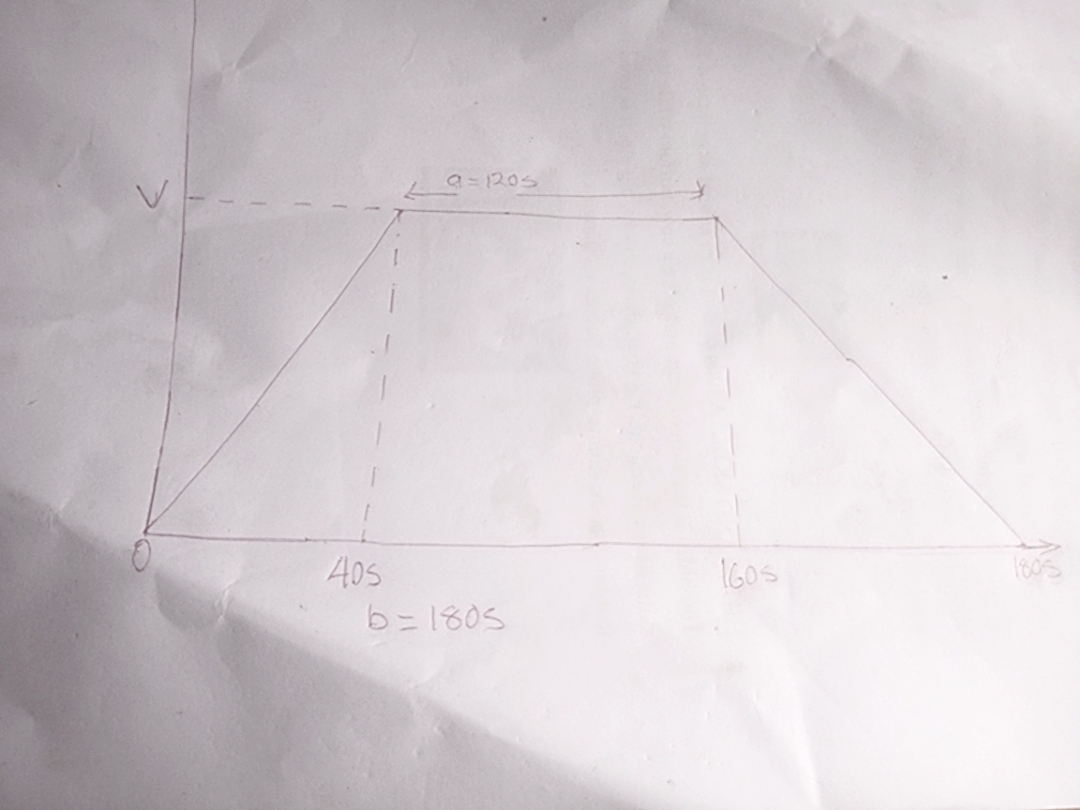
The maximum speed is given by:
$$ \text{total distance} = 6km = 6000m $$
$$ \text{total time} = 3 mins = 3 × 60 = 180s $$
$$ \text{if s} = \frac{1}{2}(a +b) × V $$
$$ V = \frac{2s}{(a+b)} $$
$$ V = \frac{2 × 6000}{(120 + 180)} $$
$$ V = \frac{12000}{300} $$
$$ V = 40m/s $$
-
$$ Retardation = \frac{∆v} {∆t} $$
$$ Retardation = \frac{0- 40}{180-160} $$
$$ Retardation = -2m/s² $$
Example 2: A particle moving in a straight line with uniform deceleration, has a velocity of 40m/s at a
point P, 20m/s at a point Q and come to rest at a point R, where QR=50M.calculate the
- distance PQ
- Time taken to cover PQ
- Time taken to cover PR
(WAEC)
Solution
Since the body undergoes uniform decceleration, At QR, s = 50m
$$ hence, $$
$$ v² = u² + 2as $$
$$ u = 20m/s \text{( vel. at Q)} $$
$$ v = 0 \text{( body comes to rest)} $$
$$ 0 = 20² - 2 × a × 50 $$
$$ a = \frac{400}{(2 × 50)} $$
$$ a = 4m/s² $$
$$ a = (-)4m/s² $$
$$\text{ since the body is decelerating} $$
- To calculate distance PQ
$$ v² = u² + 2as $$
$$ v = 20m/s $$
$$ u = 40m/s $$
$$ 20² = 40² + 2 × (-4) × s $$
$$ s = \frac{-1200}{-8} $$
$$ s = 150m $$
- Time taken to cover PQ
$$ v = u + at $$
$$ 20 = 40 + (-4) × t $$
$$ t = \frac{-20}{-4} $$
$$ t = 5s $$
- Time taken to cover PR
$$ v = u + at $$
$$ v = 0 $$
$$ u = 40 $$
$$ 0 = 40 + (-4)t $$
$$ t = \frac{-40}{-4} $$
$$ t = 10s $$
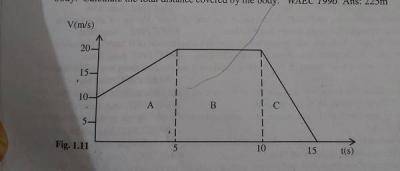
Example 3:The diagram above illustrates the velocity-time graph of the motion of a body. Calculate the
total distance covered by the body
Solution
$$ \text{Total distance} =
\text{area of the graph} $$
$$ \text{Distance of A} = \text{Area of trapezium} $$
$$ s = \frac{1}{2}(a+b) × c $$
$$ where, \text{ a} = 10 $$
$$ b = 20 $$
$$ c = 5 $$
$$ s = \frac{1}{2}(20 + 10) × 5 $$
$$ s = 75m $$
$$ \text{Distance covered at B} $$
$$ s = \text{area of a rectangle} = l × b $$
$$ = 20 × 5 = 100m $$
$$\text{Distance covered at C} $$
$$ s = \text{area of a triangle} = \frac{1}{2}bh $$
$$ s = \frac{1}{2}×5 × 20 $$
$$ s = 50m $$
$$ \text{Total distance} = 100 + 50 + 75 $$
$$ \text{Total distance} = 225m $$